Leibniz Institute for Applied Geophysics, Stilleweg 2, 30655 Hanover, Germany
Dataset
EDITORIAL
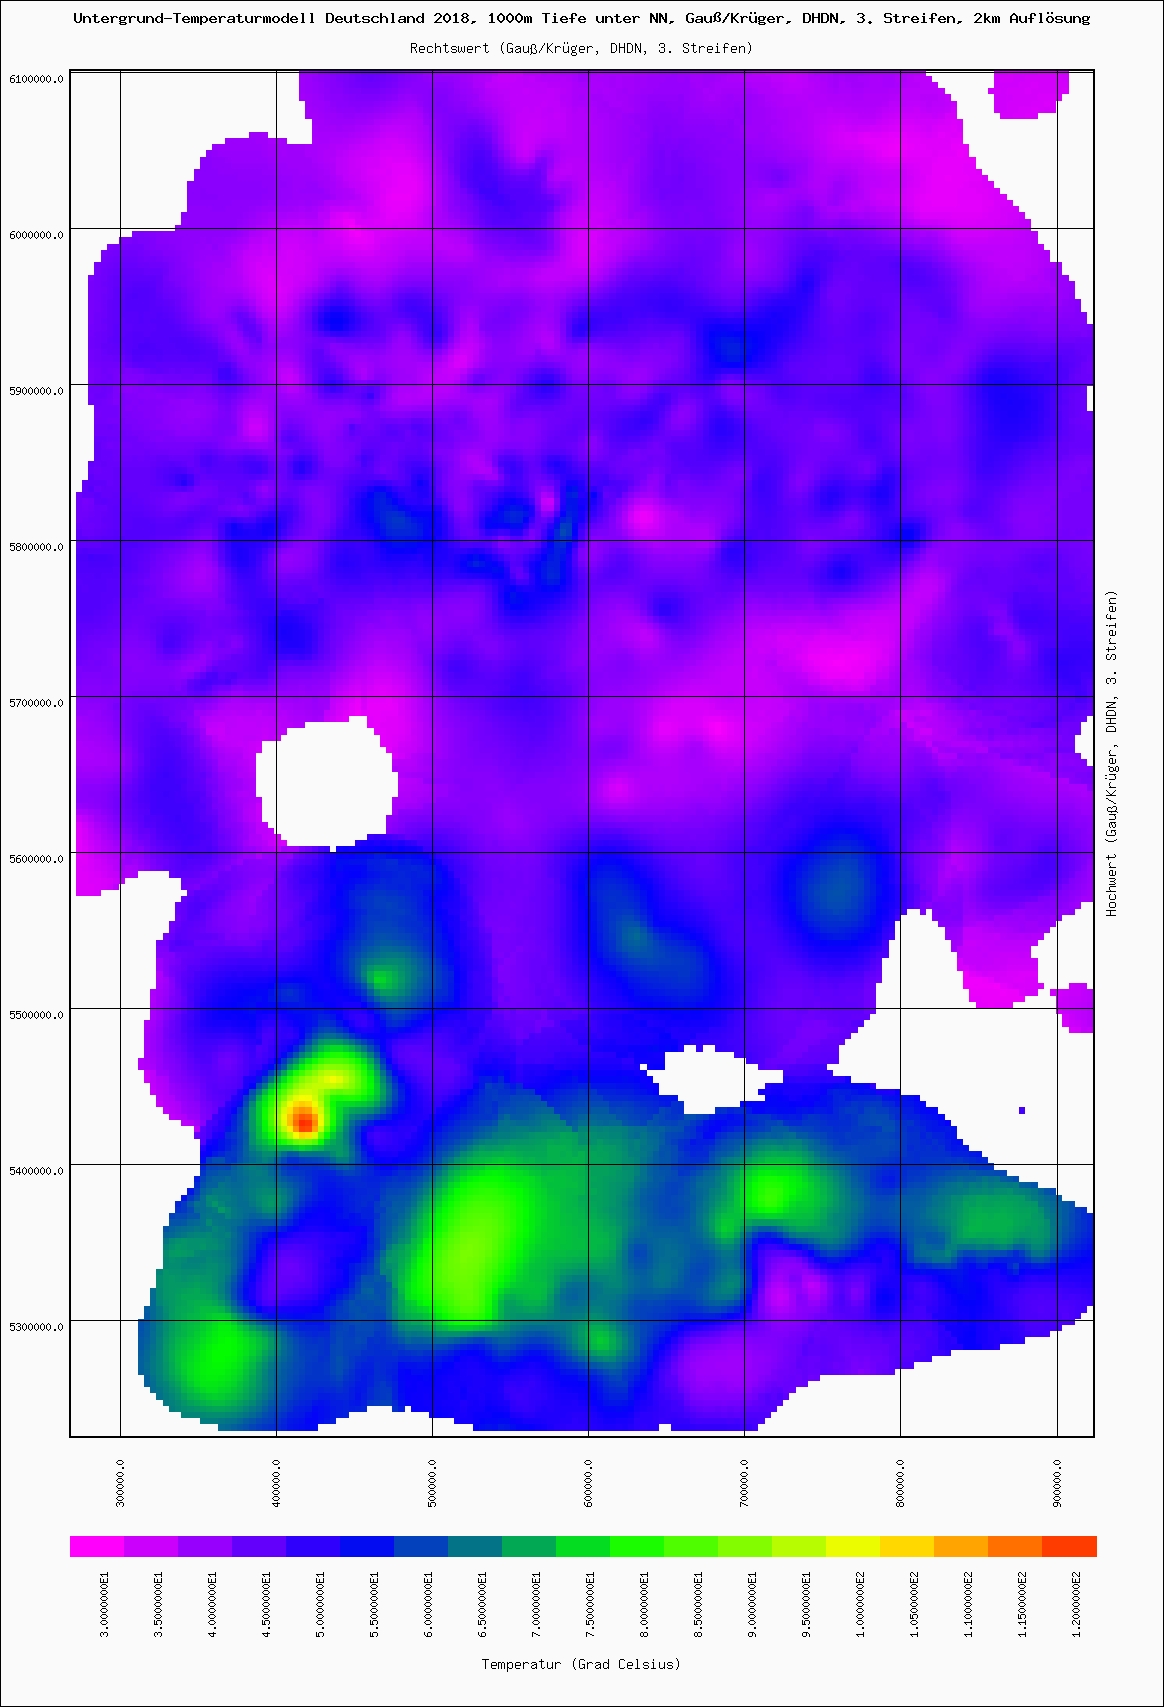
Untergrund-Temperaturmodell Deutschland 2018, 0m bis 5000m Tiefe unter NN, 51 Grids im Intervall von 100m, Gauß/Krüger, DHDN, 3. Streifen, 2km Auflösung.
Subject(s)
geothermal, temperatures, 2d grids
Measurement Parameters
temperature
Contributor(s)
Agemar, Thorsten (researcher, contact person); Brunken, Joern Marcus (data manager)
Funder
DFG (German Research Foundation)
Abstract
This geostatistical 3D subsurface temperature model of Germany and Upper Austria is based on soil temperatures and deep subsurface temperature measurements retrieved from the Geophysics Information System (FIS-GP). The depth specifications of the grid refer to sea level. The lateral grid width is 2000 m and vertical 100 m. The model ranges from 0 to 5000 m below sea level. Each file contains one depth layer. It is an integral part of the geothermal information system GeotIS, which like the FIS-GP is operated by the Leibniz Institut for Geophysics.
Location Box 1
Germany, Upper Austria
West-Longitude
5.86°
South-Latitude
47.26°
East-Longitude
15.05°
North-Latitude
55.06°
RIGHTS AND DOWNLOAD
Rights
Attribution-NonCommercial-NoDerivatives 4.0 International (CC BY-NC-ND 4.0)
Agemar, T., Schellschmidt, R. & Schulz, R. (2012): Subsurface Temperature Distribution of Germany. – Geothermics, 44: 65-77. DOI: https://doi.org/10.1016/j.geothermics.2012.07.002
NEWS
Last data sets
Tabelle der physikalisch-chemischen Eigenschaften und Zusammensetzung von Thermalwässern URL
Last publications
Fachinformationssystem Geophysik: Änderung der BHT-Korrekturverfahren für einfach belegte Messungen URL
IMAGE
2G-Grid LIAG_GRD_TE_TMOD1000_GK3_2KM = Untergrund-Temperaturmodell Deutschland 2018, 1000m Tiefe unter NN, Gauß/Krüger, DHDN, 3. Streifen, 2km Auflösung mit dem Z-Parameter Temperatur (in Grad Celsius). Nicht vom Grid abgedeckte Zellen sind in der Karte weiß dargestellt. In diesen Zellen kann keinerlei Aussage zur Z-Eigenschaft gemacht werden.



 https://doi.org/10.25899/div-12345-1